유전알고리즘을 이용한 차량용 댐퍼의 최적설계에 관한 연구


Abstract
A damper is a hydraulic device designed to absorb or eliminate shock impulses which is acting on the sprung mass of car body. It converts the kinetic energy of the shock into another form of energy, typically heat. The main mechanism for providing damping is by shearing the hydraulic fluid as it flows through restrictions. Since the damping mechanism depends on the flow restrictions, these restrictions are very important in damper design. Damper engineers often try several combinations of valve shims, piston orifices and bleed orifices before finding the best combination for a particular setup on a car. Therefore, the ability to tune a damper properly without testing is of great interest in damper design. For this reason, many previous researches have been done on modeling and simulation of the damper. This paper explains a genetic algorithm method to find the optimal parameters for the design objective and the simulation results agree well with the targeted damping characteristics.
Keywords:
Damper, Genetic algorithm, FV curve, Piston valve, Body valve1. 서 론
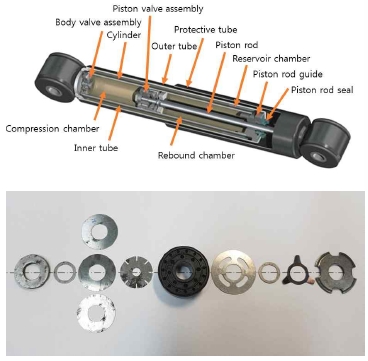
차량용 현가장치는 댐퍼와 스프링 그리고 각종 링크 등으로 구성되며 노면으로부터 발생하는 진동을 흡수하고 차체의 진동을 억제하여 차량의 승차감을 향상시킨다. 차량의 승차감에 가장 큰 영향을 미치는 댐퍼는 2개의 튜브로 구성된 튜윈튜브(twin tube) 유압식 댐퍼가 주로 사용되고 있다. 튜윈튜브 댐퍼는 Fig. 1과 같이 피스톤로드 끝단에 설치된 피스톤밸브 어셈블리와 내부 튜브(inner tube) 하단에 설치된 몸체밸브 어셈블리에 조립된 각종 교축의 조합에 의해 필요한 감쇠력을 발생하도록 하는 구조로 되어 있다.
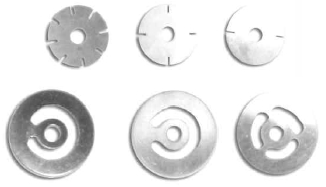
Fig. 2에 댐퍼에 사용되고 있는 블리드밸브(그림의 상단)과 흡입밸브(하단)의 다양한 형상을 나타내었다. 이러한 댐퍼의 구조 및 작동원리는 이전의 연구4~5)에서 자세히 제시되었다. 댐퍼와 관련된 초기의 연구는 1977년 Lang1)에 의해 수행되었다. Lang은 논문에서 튜윈튜브 댐퍼의 감쇠력 특성을 모델링 한 해석적 모델을 제시하고, 실험을 통하여 1~10 Hz의 주파수 영역에서 모델의 유용성을 증명하였다. 2002년 Talbott과 Starkey2)는 스톡 카 레이싱(stock car racing)용 모노튜브(mono tube) 댐퍼의 모델을 제안하였고 실험을 통하여 실제 댐퍼의 성능과 매우 유사함을 보였다. 2011년 Hou와 Li3) 등은 Modelica 프로그램을 이용하여 튜윈튜브 댐퍼의 해석적 모델을 제안하였고 실험 결과와 잘 일치하는 결과를 얻었다. 국내에서도 댐퍼의 성능에 대한 다양한 연구4~5)가 진행되어 튜윈튜브 댐퍼에 대한 비선형 해석모델과 시뮬레이션 모델 등이 제안되었고 다양한 설계변수의 변화에 대한 댐퍼 성능 변화가 연구되었다. 댐퍼의 최적화와 관련해서는 Bircan6)와 Chatterjee7) 등에 의해 최적의 댐퍼 스프링과 재질 선택을 위하여 다구찌법 등을 적용하여 최적화 설계가 연구되었으며, 댐퍼와 같은 유압부품의 최적화 설계에 대해서는 유압 체크밸브에 대하여 NLPQL 최적화 기법을 적용한 연구8)가 진행되었지만, 차량용 댐퍼의 상세설계에 최적화 설계가 적용된 경우는 국, 내외적으로 드문 편이다.
한편, 차량용 댐퍼 설계에 있어서 실험에 의하지 않고 설계자가 원하는 감쇠력 특성을 가진 댐퍼를 시장의 수요에 맞게 신속하게 설계할 수 있는 능력은 매우 중요한 문제이다. 따라서 본 연구에서는 댐퍼 단품을 대상으로 댐퍼의 감쇠력 특성을 결정하는 피스톤밸브와 몸체밸브의 대표적인 설계변수 6개를 선정하고 이에 대하여 유전알고리즘(GA, genetic algorithm)에 의한 최적화 기법을 적용하여 설계자가 원하는 감쇠력 사양에 가장 최적화된 설계변수를 도출하는 방법에 대하여 연구하였다.
2. 차량용 댐퍼의 최적화 설계
2.1 최적화 전 댐퍼의 성능 검증
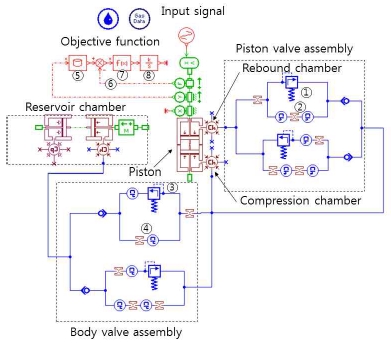
Fig. 3에 최적화 설계 전, 후의 댐퍼 성능을 확인하기 위한 시뮬레이션 모델4~5)을 나타내었다. 본 연구에서는 유공압 전용 해석 소프트웨어인 LMS Imagine.Lab Amesim을 사용하였다. 시뮬레이션 모델은 피스톤밸브 어셈블리, 몸체밸브 어셈블리, 저장실, 피스톤 본체 등으로 구성되어 있으며, 입력은 피스톤 상단에 위치한 입력신호(input signal)로부터 진폭 ±40 mm, 4 Hz의 사인함수를 인가하였다.
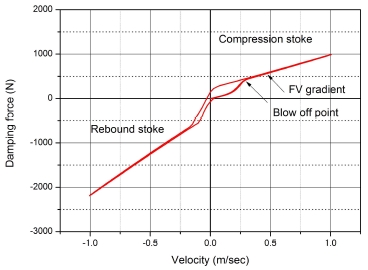
아래의 Table 1에는 시뮬레이션에 사용한 주요 물성치의 데이터를 나타내었다. Fig. 4에는 이와 같은 조건을 이용하여 시뮬레이션 한 최적화 전 댐퍼의 감쇠력-속도선도(FV curve)를 나타내었다.
그림에서와 같이, 최적화 이전 감쇠력 특성은 압축과 인장행정에서의 블로오프 포인터(blow off point)의 값이 각각 0.3 m/sec에서 420 N와 0.15 m/sec에서 588 N으로 나타났다. 그리고 속도 ±1.0 m/sec에서의 감쇠력은 각각 988 N과 2,190 N을 나타내었다.
2.2 최적설계 기법과 모델 구성
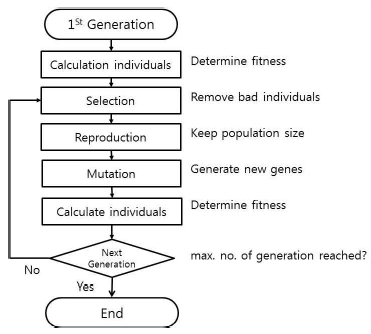
최적화 기법에 사용한 유전알고리즘은 자연계의 진화과정에 기초한 계산모델로서 존 홀랜드(John Holland)에 의해서 1975년에 개발된 전역 최적화 기법으로, 최적화 문제를 해결하는 기법의 하나이다. 유전알고리즘의 계산과정은 Fig. 5에 나타내었고, 첫 번째 단계는 균일분포(uniform distribution)를 가진 1세대의 초기 개체군(population)을 무작위로 생성한다. 다음으로, 종료조건이 만족될 때까지 모집단의 개체의 적응도(fitness) 평가, 개체의 적응도를 기준으로 교차(crossover)에 참여 할 염색체의 선택(selection), 선택된 염색체들의 유전자를 교환하여 새로운 개체를 만드는 교차, 교차를 통하여 만들어진 새로운 개체의 유전자를 임의로 변환하는 돌연변이(mutation)의 적용을 반복한다. 종료 조건은 개체군의 세대가 미리 정해진 최대 세대수에 이르렀는지를 확인한다. 만일 최대수라면 유전알고리즘의 실행을 종료한다. 이때의 개체군 중에 가장 적응도가 높은 염색체를 최적해에 가장 근접한 해로 간주한다. 만일, 최대 세대수를 초과하지 않는다면 새로 생성된 개체군을 부모세대로 삼아 적응도 계산에서부터 다시 시작한다.
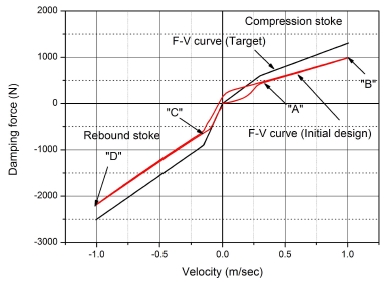
최적화 설계를 위한 시뮬레이션 모델은 Fig. 3에서와 같이 목표로 하는 FV선도의 데이터 파일(그림의 ➄)과 실제 댐퍼의 계산 결과에서 나온 FV선도의 값(➅)을 비교하여 오차를 제곱하고 적분(➆, ➇)하여 그 값이 최소가 되도록 목적함수를 설정하였다. Fig. 6에 최적화 설계 전 댐퍼와 목표로 하는 댐퍼의 FV선도를 비교하여 나타내었다. 그림에서와 같이 최적화 설계를 위하여 압축행정의 블로오프 포인트(A)에서의 목표 감쇠력을 420 N에서 600 N으로, 댐퍼 작동속도 1 m/sec인 (B)에서의 감쇠력을 988 N에서 1,300 N으로 설정하였으며, 인장행정에서도 각각 블로오프 포인트(C)에서의 목표 감쇠력을 588 N에서 900 N으로, (D)에서의 감쇠력을 2,190 N에서 2,500 N으로 목표 감쇠력을 설정하였다. 인장 압축 모두 하드(hard)한 특성을 갖도록 목표 감쇠력을 설정하였다.
이러한 최적화 설계를 위하여 Table 2와 같이 댐퍼의 감쇠력 특성에 가장 영향을 미치는 피스톤밸브와 몸체밸브의 6개 변수를 설계변수로 잡았고 초기 설계값(default)과 최소, 최대 설계범위를 표에 나타내었다. 또한 Table 2에는 시뮬레이션에 사용한 조건들을 같이 나타내었다. 여기서, Population size는 1세대 개체군에서의 개체(individuals)의 크기, Reproduction ratio는 새로운 개체에 의해 대체되는 개체군의 퍼센트, Mutation probability는 돌연변이가 발생할 확률을 의미한다.9)
3. 최적설계 결과
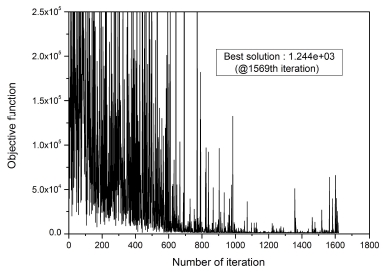
Fig. 7에 최적화 과정 중 목적함수가 최적화되는 과정을 나타내었다. 시뮬레이션은 약 1,620회 반복(iteration) 수행되었으며, 시뮬레이션 초기에는 목적함수가 상당히 큰 값을 나타내지만, 1,000회 이후에는 최소값으로 안정적으로 수렴함을 알 수 있다. 최적의 설계변수는 1,569번째 반복계산에서 계산되었다.
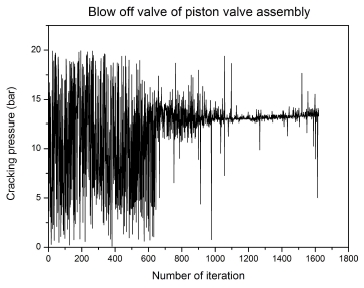
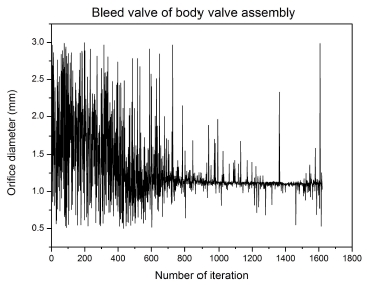
Fig. 8과 9에 설계변수인 피스톤밸브 어셈블리의 블로오프밸브 크래킹압력과 몸체밸브 어셈블리의 블리드밸브 오리피스 직경의 최적화 과정을 보여주고 있다. 그림에서와 같이 두 가지 설계변수 모두 목적함수와 유사하게 1,000회 이후 안정적으로 수렴하여 최적의 설계변수인 14.16 bar와 1.16 mm가 도출되었다.
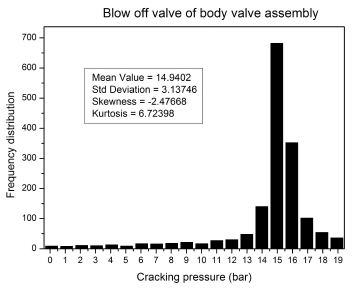
또한 Fig. 10에 설계변수 중의 하나인 몸체밸브 어셈블리의 블로오프밸브 크래킹압력의 최적화 계산중에 나타난 크래킹압력 값의 영역과 횟수를 히스토그램으로 나타내었고, 평균, 표준편차, 왜도 등의 통계적 특성치를 같이 표시하였다. 그림에서와 같이 크래킹압력의 최적값은 15 bar 부근에서 682회로 가장 많이 나타났음을 알 수 있다. 그림에 나타낸 평균, 표준편차, 왜도(skewness) 및 첨도(kurtosis)는 다음 식과 같이 정의한다.
| (1) |
이상과 같은 계산과정을 거쳐 최종적으로 계산된 최적의 설계변수를 Table 3에 나타내었다.
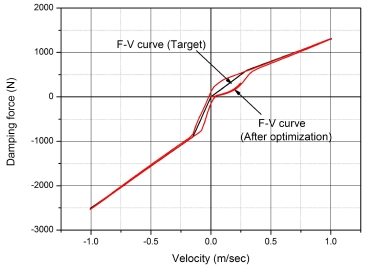
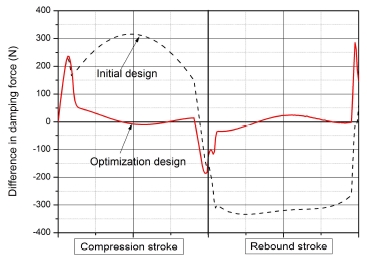
Fig. 11에 Table 3의 최적설계 결과를 적용한 시뮬레이션 결과를 나타내었다. 그림에서와 같이 최적으로 설계된 댐퍼의 FV선도는 목표로 한 FV 선도와 매우 잘 일치함을 알 수 있다. 또한, Fig. 12에 초기 설계값과 최적화된 설계값을 이용하여 계산한 감쇠력과 목표로 한 감쇠력과의 차이를 나타내었다. 그림에서와 같이 전체적으로 최적화된 설계 값의 경우가 목표로 한 감쇠력과의 차이가 작음을 알 수 있다. 특히 인장과 압축 행정의 중간영역에서는 오차가 매우 작음을 알 수 있다.
4. 결 론
이상과 같이 차량용 튜윈듀브 댐퍼를 대상으로 감쇠력을 결정하는 주요 파라미터를 설계변수를 설정하고, 목표로 한 감쇠력과의 차이가 최소가 되는 설계변수를 도출하기 위하여 유전알고리즘을 적용하여 최적화 계산을 수행하였다. 이아 같은 최적화 과정에 대한 연구를 통하여 다음과 같은 결론을 얻을 수 있었다.
1) 약 1,620회 반복 수행 중 최적의 설계변수는 1,569번째 반복계산에서 계산되어, 유전알고리즘은 세대가 거듭될수록 최적에 가까운 값을 계산함을 알 수 있었다.
2) 약 1,000회 반복 수행 이후에는 목적함수의 변화가 매우 적으므로, 시뮬레이션 시간에 큰 영향을 미치는 최대 세대수(maximum number of generation)를 적당히 조절 할 필요가 있다.
3) 유전알고리즘을 이용한 최적화 설계는 댐퍼와 같이 설계 파라미터가 많고 복잡한 유압부품 설계에서, 파라미터들의 변동에 대해 최적의 값을 단순 반복계산에 의해 구하기 어려운 경우에 최적의 값을 손쉽게 구할 수 있는 방법을 제시한다.
References
- L. H. Harvey, (1977), "A study of the characteristics of automotive hydraulic dampers at high stroking frequencies", Ph. D. dissertation, university of michigan.
-
M. S. Talbott, and J. Starkey, (2002), "An experimentally validated physical model of a High-Performance Mono-Tube Damper", Proceedings of the 2002 SAE Motorsports Engineering Conference and Exhibition.
[https://doi.org/10.4271/2002-01-3337]

- Y. Hou, L. Li, P. He, Y. Zhang, and L. Chen, (2011), "Shock Absorber Modelling and Simulation Based on Modelica", Proceedings of 8th Modelica Conference, p843-846.
- C. T. Lee, D. H. Kwak, B. H. Jung, and J. K. Lee, (2003), "A Study on the Nonlinear Dynamic Modeling and Analysis of Damping Force Characteristics of Automotive Shock Absorber", Transaction of the Korean Society of Automotive Engineers, 11(1), p104-111.
- C. T. Lee, and J. K. Lee, (2003), "A Study on the Influence of Design Parameters on the Automotive Shock Absorber Performance", Journal of the Korean Society of Precision Engineering, 20(6), p167-177.
- D. A. Bircan, and A. Yasar, (2014), "Design, Analysis and Optimization of a Shock Absorber", Journal of Agriculture Machinery Science, 10(4), p293-299.
- S. Chatterjee, and S. Nandy, (2018), "Optimization of a shock absorber using Finite Element Analysis", International Journal of Science, Engineering and Technology Research(IJSETR), 7, p564-568.
-
C. T. Lee, (2017), "A study on the optimization design of check valve for marine use", Journal of the Korean Society for Power System Engineering, 21(6), p56-61.
[https://doi.org/10.9726/kspse.2017.21.6.056]

- LMS AMESim User Manual, 2016.
