Degradation Process for Azo Dye by Ferrate (VI)
Abstract
Azo dye is one of the anthropogenic dyes that consumes water and cause water pollutant the most. Therefore, the present work aims to develop a treatment process for a common azo dye used by industrial factories (orange II) utilizing powerful oxidant potassium ferrate (VI). This process has been studied at various parameters in this study (pH, initial concentration of orange II, ferrate (VI) dosages, and temperature). The optimal degradation condition for Orange II was acidic condition and with [ferrate (VI)] = 50 mg/L, the removal rate reached 77.41%. The kapp value obtained under this experimental condition was 421.27 M-1s-1. The study shows that the decolorization rate of orange II heavily depends on the amount of ferrate (VI). As the ferrate (VI) dosage increased, the removal rate of orange II increased. In addition, the removal rate of orange II improved with the solution temperature. Furthermore, the degradation patterns of this azo dye was also investigated.
Keywords:
Degradation Rate, Orange II, Ferrate (VI)1. Introduction
With the increasing use of synthetic chemical dyes over the past few years, a considerable amount of dye-containing industrial wastewater effluent is discharged into aquatic and soil environments. The textile industry produces a significant amount of dye effluent, which contains highly toxic metal complex dyes. As materials can absorb only 20~80% of the dye from dye mixtures, depending on their limited absorption capacity, approximately 10~15% of the dyes are released into effluents. Azo dyes, containing one or more azo groups (-N═N-) in their chemical structure, account for 50~70% of the synthetic dyes that are used in textiles, papers, food, cosmetics, and pharmaceuticals.
Among chemically synthesized dye-stuffs azo dyes are produced in the largest quantities. The treatment of this dye-activated sludge is ineffective. Generally, adsorption on activated carbon and coagulation by a chemical agent is applied to such effluents.1) However, these methods merely transfer dye from water to solid; hence, further treatment is necessary for the ultimate solution. Therefore, chemical oxidation is always a fundamental method for treating water and industrial wastewater. Potassium Ferrate (VI) (K2FeO4) has been investigated and proved to be extremely efficient in removing the azo dye. This purple salt is monomeric with a high degree of four ‘Covalent character” equivalent oxygen atoms.2)
2. Experimental setup and analytical methods
2.1 Synthesis of Ferrate (VI)
The technique to produce Potassium Ferrate (VI) used was the wet technique because it is safe and it was described in another article.3,4) Ferrate (VI)'s purity using in this study was approximately 93%.
2.2 Experimental procedure
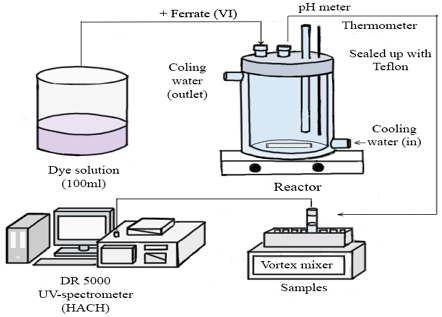
All experiments for Orange II degradation using Ferrate (VI) were set up as followed: Orange II solution was dissolved in 100 ml pure water. For the pH parameter, the solution was adjusted into different pH (4, 7 and 10) using buffer solution. The temperature parameter was controlled using a water jacket with thermometer. Different Ferrate (VI) dosages, different Orange II initial concentration parameter was carefully scale for the precise amount.
The degradation experiment was carried out by adding Ferrate (VI) dose into the solution in the reactor and turned on the stirring. A sample was taken at a specific time, and immediately quenched with Na2S2O3.5H2O to stop further reaction. The absorption value was evaluated by DR 5000 UV - spectrometer from Canada (λ=486 nm for Orange II).
2.3 Analytical formular
In this study, a calibration curve was utilized to determine the concentration of Orange II. Using the DR - 5000, the dye absorption (abs) in the samples were collected, and applied that value into the calibration curve to find out the remaining of the dye in the solution. The Orange II % degradation efficiency will be calculated using equation (1).
| (1) |
3. Results and discussion
3.1 Effect of pH on the degradation of Orange II
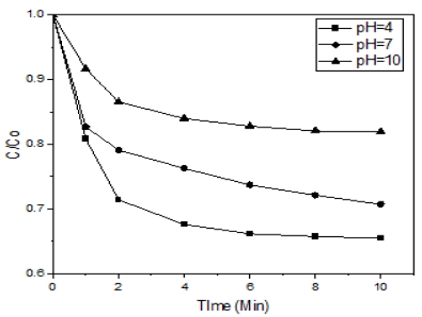
According to Fig. 2, in the acidic condition, the Orange II solution saw the highest degradation rate (34.52%), followed by pH 7 (29.298%) and the least favorable condition was pH 10 (18.06%). degradation rate (34.52%), followed by pH 7 (29.298%) and the least favorable condition was pH 10 (18.06%).
As the Fig. 2 showed, Orange II oxidize very quickly by the Ferrate (VI) at pH 4 and reached its peak after 1-2 minute. Furthermore, Orange II losing its colour under condition of pH > 9, and after 10 min of treatment, the purple colour from Ferrate (VI) was remain in the solution. The pK1, pK2, pK3 values for the deprotonation of H3FeO4+, H2FeO4,and HFeO4− are 1.6 ± 0.2, 3.5 and 7.227 ± 0.074, respectively.5) Therefore, the main species in low pH condition is HFeO4−. HFeO4− has faster reaction than FeO42- in solution. According to the species distribution of Orange II, when pH > 12, only species exists in the solution was L2-or OR2-. When 12 > pH > 8, HL-or HOR co exists in solution with L2-. Below pH 8 most of the species were HL- or H2OR6. Orange II's adsorption is more effective at below pH 7, because L2- is not present in the solution and reaches its peak at pH 3.5 when lots of specie HL- appear. In addition, 8 was the point of zero charges (pHpzc) of the decomposition products of Potassium Ferrate (VI).
Therefore, when the solution below pH 8, Ferrate (VI)'s surface depletion products protonated (≡Fe-OH2+), which responsible for the electrostatic attraction of the negatively charged HL-, thus it enhanced the adsorption efficiency of Orange II by Ferrate (VI) final decomposition products at acidic pH values.
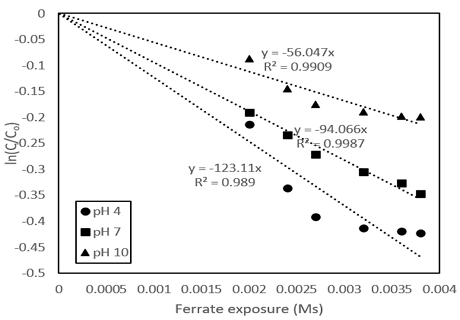
Kinetic studies in the pH parameter were also investigated. The kinetics was followed the law of second-order reaction rates7) (Equation (2)), and is rearranged to become (Equation (3)).
| (2) |
| (3) |
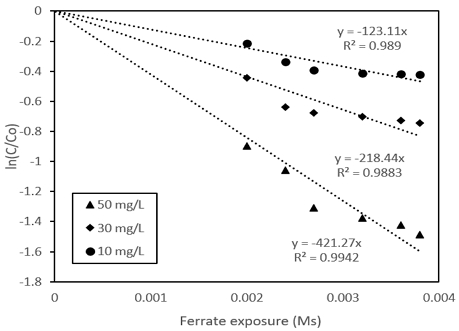
3.2 Effect of different dosages of Ferrate (VI) on the degradation of Orange II
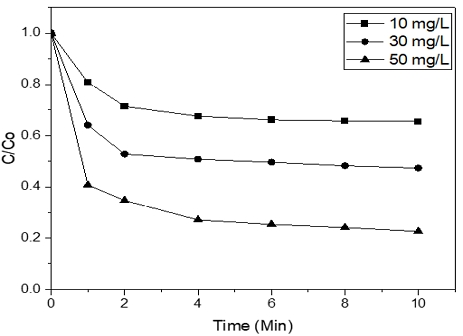
Fig. 4 demonstrated, the best degradation rate is belong to Co [Ferrate(VI)] = 50 mg/L (77.41%), next to that was Co [Ferrate] = 30 mg/L (52.57%) and Co [Ferrate] = 10 mg/L (34.52%). These results showed that the more Ferrate (VI) dosage use, a better removal rate of Orange II can be achieved and the reason for that is Ferrate (VI) by-products can lead to the formation of Fe (III), which has abilities as a natural coagulant against pollutants8. However, it is worth mentioning that too much Ferrate (VI) in the Orange II solution can cause decreasing in removal efficiency.
Similar to pH, this parameter was also carried out the kinetic studies. The reactions between ferrate and Orange II was also followed the law of second-order reaction rate at pH 4. The result in Fig. 5 indicated that with the increasing in Ferrate dosage, the rate constant (k) also went up.
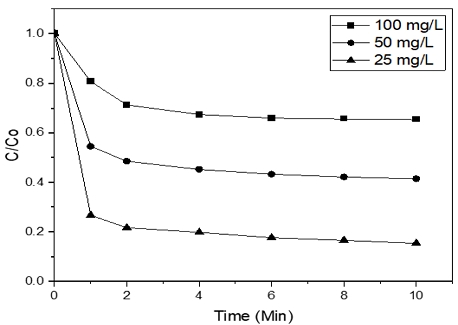
3.3 Effect of initial concentration of Orange II on the degradation
Fig. 6, the removal of Orange II by Ferrate (VI) was decreased when the initial concentration of azo dye is increased. Thus, unsurprisingly, the lowest initial concentration of dye was the best removal rate by Ferrate (VI). After 10 min reaction time with 10 mg/L of Ferrate (VI), at initial dye concentrations of 25, 50, and 100 mg/L, the decolorization percentages, were 84.58, 58.48, and 34.52%, respectively.
3.4 Effect of temperature on the degradation of Orange II
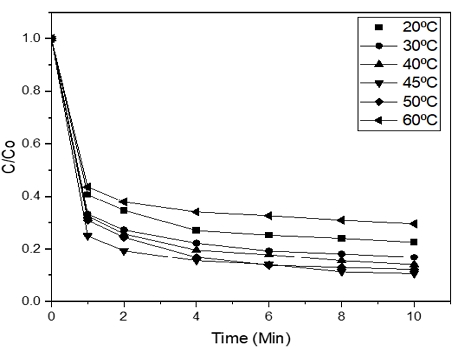
Fig. 7 showed the removal efficiency of Ferrate (VI) increased with higher temperature.
The removal efficiency of Orange II was 77.4, 83.1, 85.9, and 87.82% at 20, 30, 40, and 50℃, respectively. The lowest removal percentage was at 60℃ (70.33%). The peak degradation rate was at 45℃ (89.4%). The experimental results in temperature parameter also make sense as at higher temperatures molecules move quicker and ran into each other more often. Previous work9) showed that Ferrate (VI) solution at lower temperature such as 5℃ was more stable . It is worth mentioning that at high temperatures (for example, 55℃ or 60℃), Ferrate (VI) would be unstable which leads to the decrease in removal rate. Other researchers results also suggested that the Ferrate (VI) oxidant power decreases when the temperature is above 50℃.10)
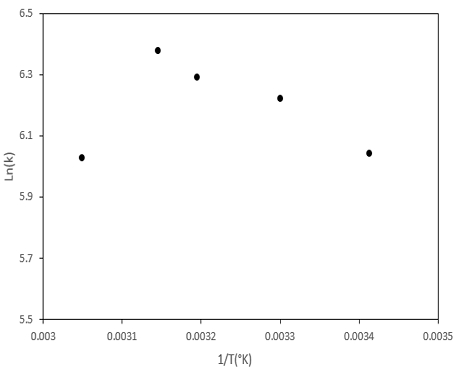
The Arrhenius plot for the reaction between Ferrate (VI) and Orange II in different temperatures was also investigated in Fig 8. Generally, the temperature is very influential in the aqueous decomposition rate of Ferrate (VI). The activation energy was calculated using the Arrhenius equation (Equation (4)), and activation energy value after calculation was 13.2 kJ/mol.
| (4) |
Where T, Ea and R are reaction temperature, activation energy, and universal gas constant (8.314 J K-1mol−1).
4. Conclusion
The experiment on the degradation of Orange II by Ferrate (VI) in different parameters and the investigation of degradation patterns of Orange II has been successfully studied.
The treatment process for a common azo dye used by industrial factories (Orange II) utilizing powerful oxidant Potassium Ferrate (VI). showed the oxidant power of Ferrate (VI) depends heavily on pH condition, Ferrate (VI) dosage, and temperature.
The acidic condition favored the decolorization of Orange II, The best temperature for remove colour of Orange II was 45oC. The properties of the target compounds and Ferrate (VI) reaction in different conditions was also studied. Overall, the results found in this paper also reaffirm the degradation power of Potassium Ferrate (VI) on azo dyes and provides some valuable data for azo dye degradation which can be applied to the real-world wastewater treatment process.
― Nomenclature ―
Acknowledgments
This work was supported by a Research Grant of Pukyong National University (2023 year).
Author contributions
N. M. Hoang; Data curation, analysis data, Investigation, Methodology, Experimenting, Writing - original draft. I. K. Kim; Data validation, Writing-review & editing.
References
- K. Higashi, M. Yamane, S. Takeda, A. Kawahara and S. Wakida, 1996, “Research survey on prevention of pollution by wastewaters”, Mizushorigijutsu, 187-200.
-
R. Kent Murmann and P. R. Robinson, 1974, “Experiments utilizing FeO42- for purifying water”, Water research, 8, 543-547.
[https://doi.org/10.1016/0043-1354(74)90062-1]

-
X. Z. Li and N. Graham, 2005, “A study of the preparation and reactivity of Potassium Ferrate”, Chemosphere, 61(4), 537-543.
[https://doi.org/10.1016/j.chemosphere.2005.02.027]

-
N. M. Hoang and I. K. Kim, 2022, “Degradation of Eriochrome Black T by Potassium Ferrate (VI)”, Journal of Water and Sewerage, 36(3), 167-175.
[https://doi.org/10.11001/jksww.2022.36.3.167]

-
V. K. Sharma, R. A. Yngard, D. E. Cabelli and J. C. Baum, 2008, “Ferrate (VI) and Ferrate (V) oxidation of cyanide, thiocyanate, and copper(I) cyanide”, Radiation Physics and Chemistry, 77, 761-767.
[https://doi.org/10.1016/j.radphyschem.2007.11.004]

-
X. Liang and F. Fenglian, 2020, “Se(IV) oxidation by ferrate(VI) and subsequent in-situ removal of selenium species with the reduction products of ferrate(VI): performance and mechanism”, Journal of Environmental Science and Health, Part A, 1-9.
[https://doi.org/10.1080/10934529.2019.1710422]

-
H. L. Kinetics, 2019, “Kinetics and mechanism of the oxidative degradation of parathion by Ferrate(VI)”, Chem. Eng., 142-152.
[https://doi.org/10.1016/j.cej.2019.02.040]

-
L. Zheng, 2020, “Chemically Enhanced Primary Treatment of Municipal Wastewater with Ferrate (VI)”, Water Environment, Res. 93, 817-825.
[https://doi.org/10.1002/wer.1473]

-
W. F. Wagner, J. R. Gump and E. N. Hart, 1952, “Factors Affecting Stability of Aqueous Potassium Ferrate (VI) Solutions”, Anal. Chem., 24, 1497-1498.
[https://doi.org/10.1021/ac60069a037]

-
M. Thomas, P. Drzewicz, A. Wieckol-Ryk and B. Panneerselvam, 2021, “Influence of Elevated Temperature and Pressure on Treatment of Landfill Leachate by Potassium Ferrate (VI)”, Water Air Soil Pollut, 232-450.
[https://doi.org/10.1007/s11270-021-05401-y]


