Characterization of the EIS Diffusion Region in Cylindrical Lithium-Ion Batteries as a Function of Temperature and State of Charge

Abstract
This study investigates the effect of temperature and state of charge (SoC) on the electrochemical impedance characteristics of the diffusion region in cylindrical lithium-ion batteries. The increasing occurrence of fires and explosions related to lithium-ion batteries, which are widely employed in energy storage applications, underscores the necessity for enhancing their inherent safety features. Consequently, electrochemical impedance spectroscopy (EIS) is employed in the frequency range of 1 kHz to 0.1 Hz as an analytical technique for energy storage systems. Reflected wave analysis is then utilized to monitor internal impedance variations in the lithium-ion battery. Variations in the low-frequency diffusion region are examined in terms of their dependence on the structural and material characteristics of the diffusion layer and electroactive components of the lithium-ion battery. This study employs a 3000 mAh-class NCA (Li[Ni,Co,Al]O2) 18650 lithium-ion battery, which is widely used in energy storage systems, electric scooters, electric motorcycles, electric kickboards, and compact electric vehicles. Depending on the characteristics of the diffusion layer and electroactive material, lithium-ion batteries exhibit three distinct diffusion behaviors in the low-frequency diffusion region: (1) finite-space Warburg (FSW), (2) finite-length Warburg (FLW), and (3) constant phase element (CPE). Among these, the finite-space Warburg (FSW) element is not observed, while the constant phase element (CPE) and finite-length Warburg (FLW) behaviors are observed in two cases. Furthermore, in cylindrical lithium-ion batteries, the low-frequency diffusion region—where temperature and state of charge (SoC) influence performance—can be categorized into four types: (1) Warburg diffusion, (2) semi-spherical diffusion, (3) bounded diffusion, and (4) semi-cylindrical diffusion.
Keywords:
Electrochemical Impedance Spectroscopy, Finite-Space Warburg, Finite-Length Warburg, Constant Phase Element, Warburg Diffusion1. Introduction
Due to recent incidents of fires and explosions, there is an urgent need for fundamental safety improvements in lithium-ion batteries, which are widely used as energy storage devices in electric vehicles, personal mobility devices, mobile phones, and various electronic products.1,2)
Lithium-ion batteries facilitate the efficient utilization of sustainable electric energy and support the active integration of renewable energy sources such as solar and wind power.3,4)
Battery management systems (BMS) for the stable operation of energy storage devices are the subject of active research.5,6)
The study conducted by Junqiu Li et al.7) involved a thermal characteristic analysis and impedance-based thermal modeling of lithium-ion batteries in an overcharge state, with the aim of assessing both thermal safety and the accuracy of thermal modeling.
Peng Peng et al.8) performed a numerical analysis of the thermal stability of lithium-ion batteries, focusing on the cathode material. To experimentally validate these findings for electric vehicle batteries, Jan Kleiner et al.9) developed a thermal model for prismatic lithium-ion batteries.
Karden E. et al.10) presented a frequency- domain methodology for the dynamic simulation of electrochemical power sources. M. Oldenburger et al.11) investigated the low-frequency Warburg impedance in lithium-ion batteries.
This study investigates the effects of temperature and SoC on the EIS characteristics within the diffusion region of cylindrical lithium-ion batteries. Furthermore, to evaluate internal impedance variations based on reflected wave analysis, a range of input frequencies from 1 kHz to 0.1 Hz is applied to the battery.
Depending on the properties of the diffusion layer and electroactive materials, lithium-ion batteries exhibit three distinct diffusion pathways in the low-frequency diffusion region: (1) FSW, (2) FLW, and (3) CPE. The results indicate that cylindrical lithium-ion batteries exhibit FLW behavior under abnormal conditions—specifically, at temperatures below -5℃ and a SoC of 0%. In contrast, under normal operating conditions, when the diffusion layer and electroactive material properties are sufficient, the batteries demonstrate CPE characteristics. Depending on variations in temperature and SoC, the FLW behavior in lithium-ion batteries can manifest in three distinct forms: (1) BD, (2) SSD, and (3) SCD.
2. Diffusion characteristics in the low frequency region of cylindrical lithium-ion batteries
The complex-plane plot of the EIS data for a cylindrical lithium-ion battery is illustrated in Fig. 1.18)
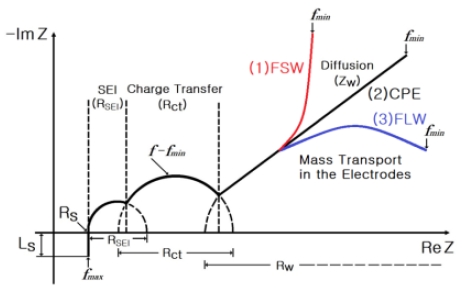
EIS of cylindrical lithium-ion battery
As shown in Fig. 1, the series inductance (Ls) is manifested in the high-frequency region (fmax), while the series resistance (Rs) is identified at the intersection of the real axis and the impedance spectrum trajectory at high frequencies.
The charge transfer process at the solid electrolyte interphase (SEI), characterized by the film resistance (RSEI) and the constant phase element (QSEI, αSEI), is represented by a small semicircle in the impedance spectrum.
When the charge transport across the electrode–electrolyte interface exceeds the capacity for charge storage, a pronounced semicircular arc emerges in the impedance spectrum. This feature is associated with the charge transfer resistance (Rct) in parallel with a constant phase element (QSEI, αSEI) representing the interfacial double-layer behavior.
The Warburg impedance (ZW), indicative of ion diffusion within the electrolyte, reflects lithium-ion transport behavior and is influenced by the structural characteristics of the diffusion layer and the nature of the electroactive material, manifesting in three distinct regimes.
In the case of the finite-space Warburg (FSW) element, both the diffusion layer and the amount of electroactive material were limited. For the finite-length Warburg (FLW) element, although the diffusion layer remained limited, the amount of electroactive material was sufficient. In contrast, the constant phase element (CPE) exhibited sufficient diffusion layer and electroactive material, with both properties further enhanced by a 45° tilt angle.
Fig. 2 displays the complex plan view of the impedance spectrum at 100% and 50% SoC of a 3000 mA class 18650 cylindrical lithium-ion battery for temperature ranging from 40℃ to -20℃ in 15℃ increments.
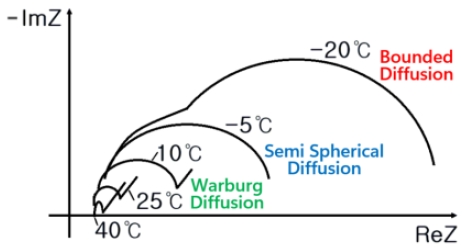
EIS curve at 100% and 50% SoC form 40℃ to –20℃
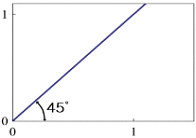
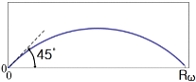
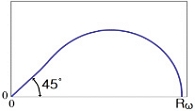
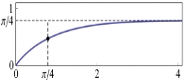
Table 1 summarizes the diffusion equations and corresponding Nyquist impedance diagrams at low frequencies observed in lithium-ion batteries.

Diffusion Equations and Nyquist Impedance Diagrams at Low Frequencies
Here,
- ZW : diffusion impedance
- Rw : diffusion resistance (horizontal axis value at the point where the imaginary part has a minimum value)
- K0, K1: coefficient for SCD
When the diffusion layer and electroactive material are sufficiently available, a characteristic WD response—manifested as a 45° slope in the Nyquist plot—emerges in the low-frequency region of the impedance spectrum. This behavior is typically observed under conditions where the SoC exceeds 50% and the temperature is above 10℃ in lithium-ion batteries.
Below 40℃, the charge transfer resistance is characterized by a relatively small semicircle, while the Warburg impedance extends, indicating enhanced diffusion behavior. However, as the temperature decreases further, the Warburg region becomes shorter, and the charge transfer resistance increases, resulting in a broader semicircle in the Nyquist plot.
At -5℃, a pronounced semi-spherical diffusion (SSD) region appears in the impedance spectrum, while the WD element, typically characterized by a 45° slope, is entirely absent. As the temperature further decreases to -20℃, the size of the BD region increases significantly.
Consequently, when the SoC is sufficiently high, the CPE behavior transitions to FLW behavior as the temperature decreases.
As shown in Fig. 2, the condition of the electrolyte changes markedly, and the resistance of the diffusion region increases sharply below -5℃ when the temperature is reduced at SoC of 100% or 50%, both exceeding a critical threshold. At -20℃, the diffusion region displays a significantly enlarged semicircle in the impedance spectrum, attributed to the increased diffusion resistance. When the diffusion layer is limited while the electroactive material remains sufficient, the charge transfer resistance (Rct) of the electrode increases, and the double-layer capacitance (QSEI, αSEI) manifests as a semicircular arc in the impedance spectrum.
As shown in Fig. 3, at 0% SoC, Warburg impedance typically appears only when both the diffusion layer and the electroactive material are sufficiently present, and the temperature exceeds 10℃.
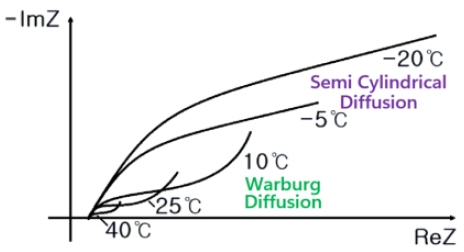
EIS curve from 40℃ to -20℃ under 0% SoC
This condition is characterized by the presence of a sufficiently developed diffusion layer and a limited quantity of electroactive material.
Below -5℃, a SCD region emerges, while the WD component is entirely absent. At -20°C, the SCD region becomes significantly more pronounced, indicating a further increase in diffusion-related resistance. The variation in the diffusion region as the temperature decreases from 40℃ to -20℃ is summarized as follows.
When the SoC is sufficient, such as at 100% and 50% SoC, the observed sequence follows WD to SSD, and then to BD. However, when the SoC is insufficient, specifically at 0% SoC, the sequence progresses from WD to SCD.
Fig. 4 illustrates the Nyquist plot of EIS for a cylindrical lithium-ion battery at SoC above 10℃.
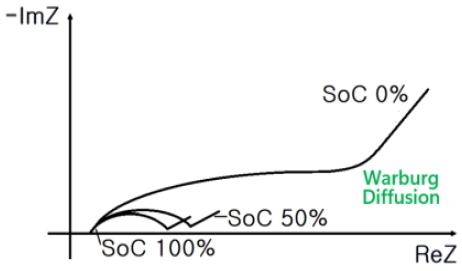
EIS curve over 10℃ from 0% SoC to 100% SoC
A semicircular arc corresponding to charge transfer is observed at 100% and 50% SoC, where the SoC exceeds a certain threshold.
However, at 0% SoC, the absence of electroactive material hinders charge transfer. In the low-frequency range, Warburg impedance characteristics are observed, manifested by a 45° slope, indicating diffusion-controlled behavior.
Fig. 5 presents the Nyquist plot of EIS for the cylindrical lithium-ion battery at -5℃, as a function of SoC.
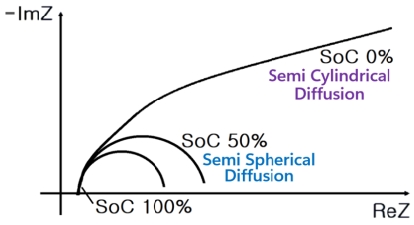
EIS Curve at -5℃ from 0% SoC to 100% SoC
Below -5℃, the diffusion layer becomes limited, and a FLW region is observed in the impedance spectrum.
A SSD region is observed at 100% and 50% SoC, whereas a SCD region appears at 0% SoC.
Fig. 6 displays the Nyquist plot of EIS for the cylindrical lithium-ion battery at -20℃, as a function of SoC.
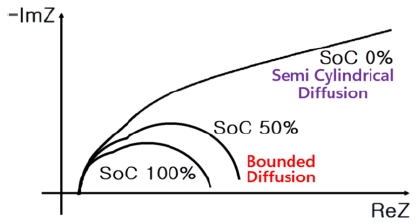
EIS Curve at -20℃ from 0% SoC to 100% SoC
Below -20℃, the diffusion layer becomes limited, and a FLW region is observed. At 100% and 50% SoC, a BD region appears, whereas at 0% SoC, a SCD region is observed.
The variation in the diffusion region with decreasing SoC from 100% to 0% is summarized as follows.
At temperatures of 40℃, 25℃, and 10℃, the process corresponds to WD. When the temperature decreases to -5℃, the sequence progresses from SSD to SCD. Further lowering the temperature to -20℃ results in the transition from BD to SCD.
The equivalent impedance of the lithium-ion battery can be quantitatively expressed by Equation (1) as follows:
| (1) |
When charge transfer occurs at the electrode interface, the electrode resistance and double-layer capacitance observed at higher states of charge are absent at 0% SoC. This behavior can be mathematically expressed as follows:
| (2) |
Equation (3) presents the impedance of the diffusion region for a 3000 mA-class 18650 cylindrical lithium-ion battery. Based on this equation, the diffusion impedance can be classified into WD, SSD, BD, and SCD types.
| (3) |
3. Experimental Results
Fig. 7 illustrates the experimental setup used for measuring the impedance of lithium-ion batteries.
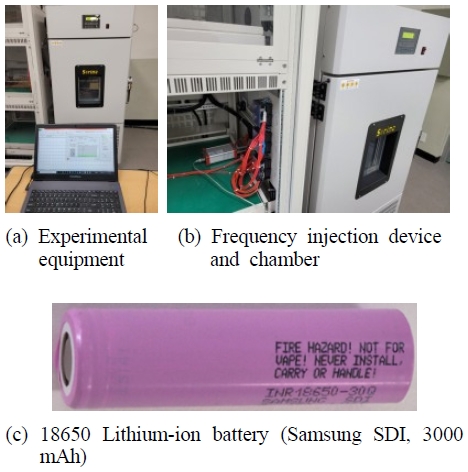
Experimental equipment for measuring the impedance of lithium-ion batteries
The properties of a single cell of the cylindrical lithium-ion battery were examined.
The analysis was conducted by considering a range of parameter values. Specifically, the SoC was evaluated at three levels: 100%, 50%, and 0%. In addition, the temperature conditions included 40℃, 25℃, 10℃, -5℃, and -20℃, to account for a wide spectrum of thermal environments.
The series inductance (Ls), series resistance (Rs), and parallel resistance (Rp) are influenced by the electrolyte properties and battery structure. Furthermore, the diffusion area impedance (ZW) at low frequencies is strongly correlated with the electrolyte’s low frequency properties, and the electric double layer is associated with the parallel capacitor (Cp).
The cell voltage of the cylindrical lithium-ion battery was 4.2 V at 100% SoC. Fig. 9 presents the impedance spectrum of the cylindrical lithium-ion battery at 100% SoC under varying temperatures.
At 100% SoC, the cylindrical lithium-ion battery exhibits a resistance value between 17.0598 and 276.9609 mΩ.
In Fig. 8, the Rs, Rp, and Ls values increase with decreasing temperature.
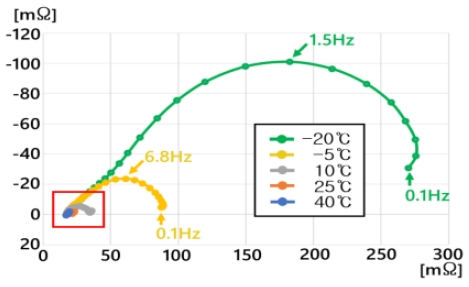
Impedance spectrum of the cylindrical lithium-ion battery at 100% SoC under different temperatures
Particularly, at -20℃, Rp rapidly increases, implying that the battery performance rapidly decreases at temperatures below -5℃.
Under 100% SoC, CPE transforms to FLW as the temperature decreases. Furthermore, at 100% SoC, the following transformation was experimentally observed with decreasing temperature : WD ▸ SSD ▸ BD.
Fig. 9 depicts an extended impedance spectrum waveform under 100% SoC at 40℃, 25℃, and 10℃.
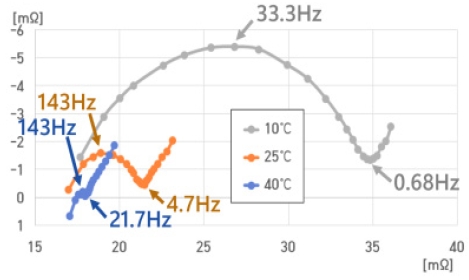
Impedance spectrum at 40℃, 25℃, and 10℃ under 100% SoC for the cylindrical lithium-ion battery
Table 2 summarizes the parameters Rs, Rp, Cp, and Ls measured at 100% SoC.
Rs, Rp, Cp, and Ls (100% SoC)
Fig. 9 illustrates that WD occurs below 21.7 Hz at 40℃, 3.3 Hz at 25°C, and 0.68 Hz at 10℃.
At -5℃, WD is absent, but SSD is present. Moreover, at -20℃, WD is absent but BD is present. The cell voltage of the cylindrical lithium-ion battery at 50% SoC was 3.65 V.
Fig. 10 exhibits the impedance spectra for the cylindrical lithium-ion battery at 50% SoC under varying temperatures.
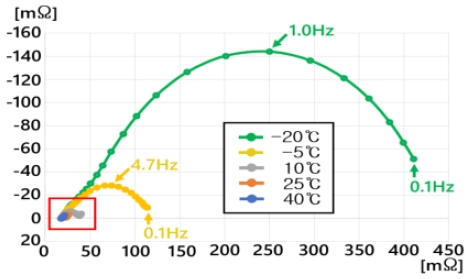
Impedance spectrum of the cylindrical lithium-ion battery at 50% SoC under different temperatures
As depicted in Fig. 10, the resistance value of the cylindrical lithium-ion battery at 50% SoC ranges from 17.4221 to 410.7092 mΩ.
As shown in Fig. 10, Rs, Rp, and Ls decrease with increasing and decreasing temperatures. Particularly, Rp quickly increases at -20℃, suggesting that the battery performance quickly deteriorates below -5℃.
Table 3 presents the values of Rs, Rp, Cp, and Ls at 50% SoC.
Rs, Rp, Cp, and Ls (100% SoC)
At 50% SoC, CPE transforms to FLW with decreasing temperature. At 50% SoC, the following transformation was experimentally observed with decreasing temperature : WD ▸ SSD ▸ BD.
Fig. 11 displays an enlarged impedance spectrum waveform at 50% SoC under 40℃, 25℃, and 10℃.
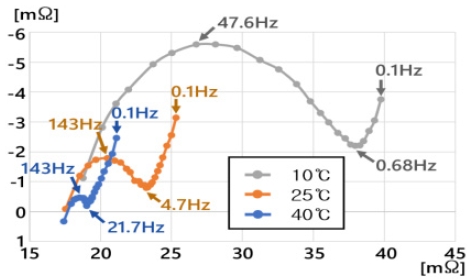
Impedance spectrum at 40℃, 25℃, and 10℃ under 50% SoC for the cylindrical lithium-ion battery
In Fig. 11, WD occurs below 21.7 Hz at 40℃, below 4.7 Hz at 25℃, and below 0.68 Hz at 10℃.
At -5℃, WD is absent, but SSD is present. At -20℃, WD is absent but BD is present.
The cell voltage of the cylindrical lithium-ion battery at 0% SoC was 2.5 V. Fig. 12 presents the impedance spectrum for the cylindrical lithium-ion battery at 0% SoC under different temperatures.
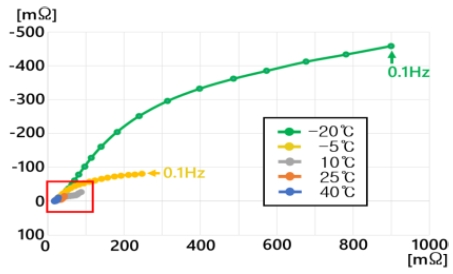
Impedance spectrum of the cylindrical lithium -ion battery at 0% SoC under different temperatures
Fig. 12 shows that the cylindrical lithium-ion battery at 0% SoC has a resistance value between 17.5448 and 899.8490 mΩ.
In Fig. 12, the Rs, Rp, and Ls values increase with decreasing temperature. However, the Cp value decreases with the temperature, in contrast to that under 100% and 50% SoC. This is because 0 Hz isthe frequency at which the imaginary axis value,
-ImZ, reaches its maximum.
Particularly, at -20℃, Rp rapidly increases, implying that the battery performance rapidly worsens at temperatures below -5℃.
Under 0% SoC, CPE transforms to FLW as the temperature decreases. At 0% SoC, the following transformation was experimentally observed with decreasing temperature : WD ▸ SCD.
Table 4 shows the electrical parameters Rs, Rp, Cp, and Ls obtained at 0% SoC.
Rs, Rp, Cp, and Ls (0% SoC)
Fig. 13 shows a large representation of the impedance spectrum waveform in Fig. 12 under 0% SoC and 40°C, 25℃, and 10℃.
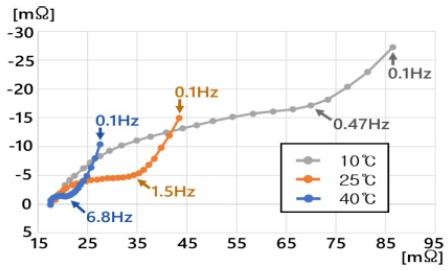
Impedance spectrum at 40℃, 25℃, and 10℃ under 0% SoC for the cylindrical lithium-ion battery
Fig. 13 illustrates that WD occurs below 6.8 Hz at 40℃, 1.5 Hz at 25℃, and 0.47 Hz at 10℃.
At -5℃ and -20℃, WD is absent but SCD is present.
At 100% SoC, Rs and Rp were small and Cp was also very small, verifying that the impedance spectrum curve progressed along the X-axis overall.
Rs and Rp at 50% SoC were somewhat greater than those at 100% SoC. At 0% SoC, Rs and Cp significantly increased along the Y-axis with a slope of about 45°.
Fig. 14 compares the performance of the cylindrical lithium-ion battery at 0%, 50%, and 100% SoC under 40°C. The resistance value of the battery ranges from 17.0598 to 27.4937 mΩ.
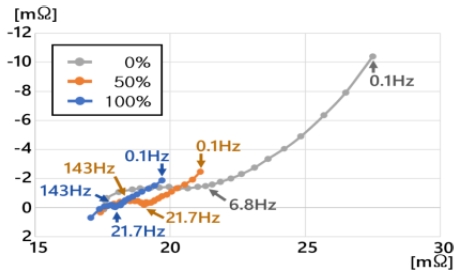
Impedance spectrum of the cylindrical lithium-ion battery at different SoCs under 40℃
Table 5 summarizes the parameters Rs, Rp, Cp, and Ls measured at 40℃.
Rs, Rp, Cp, and Ls (40℃)
At 40℃, Rs, Rp, and Ls decreased with increasing SoC, and vice versa.
However, at 0% SoC, Cp rapidly increased compared to that at 100% and 50% SoC, signifying that Cp increased with ZW for 0% SoC.
At 40℃, the diffusion area is a low-frequency characteristic that manifests as CPE = WD, as proved experimentally. Fig. 14 shows that WD occurs below 6.8 Hz at 0% SoC and below 21.7 Hz at 100% and 50% SoC.
Fig. 15 compares the impedance spectrum results for the cylindrical lithium-ion battery at 0%, 50%, and 100% SoC under 25℃. The battery’s resistance value varies between 17.5424 and 43.4072 mΩ.
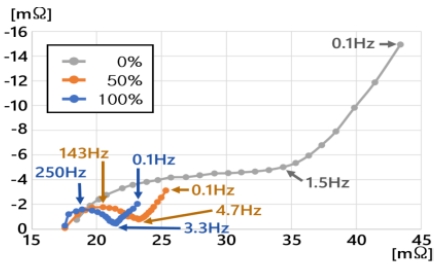
Impedance spectrum of the cylindrical lithium -ion battery at different SoCs under 25℃
Fig. 15 shows that at 25℃, Rs, Rp, Cp, and Ls decrease with increasing SoC. However, at 0% SoC, Cp rapidly increased compared to that at 100% and 50% SoC. Thus, at 0% SoC, Cp increased with ZW.
The diffusion area, a low-frequency characteristic at 25℃, was experimentally verified to manifest as CPE = WD.
Table 6 presents the values of Rs, Rp, Cp, and Ls at 25℃.
Rs, Rp, Cp, and Ls (25℃)
As depicted in Fig. 15, WD occurs below 3.3 Hz at 100% SoC, below 4.7 Hz at 50% SoC, and below 1.5 Hz at 0% SoC.
Fig. 16 compares the impedance spectrum results for the cylindrical lithium-ion battery at 0%, 50%, and 100% SoC under 10℃. The resistance value of the battery ranges from 17.6737 to 86.4376 mΩ.
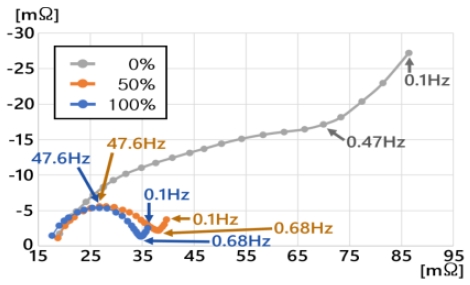
Impedance spectrum of the cylindrical lithium-ion battery at different SoCs under 10℃
Rs, Rp, and Ls decreased with increasing SoC, and vice versa. Cp increased quicker at 0% SoC than that at 100% and 50% SoC. Consequently, Cp increased with ZW at 0% SoC.
The diffusion area, a low-frequency feature, was experimentally verified to appear as CPE = WD at 10℃. Fig. 16 shows that WD occurs below 0.47 Hz at 0% SoC and below 0.68 Hz at 100% and 50% SoC.
Fig. 17 compares the impedance spectrum results for the cylindrical lithium-ion battery at 0%, 50%, and 100% SoC under -5℃. The battery’s resistance value varies between 19.1924 and 245.9957 mΩ.
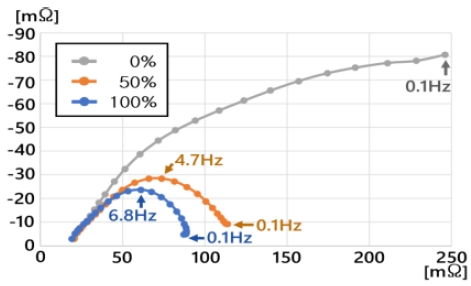
Impedance spectrum of the cylindrical lithium-ion battery at different SoCs under -5℃
Table 7 shows the electrical parameters Rs, Rp, Cp, and Ls obtained at 10°C.
Rs, Rp, Cp, and Ls (10℃)
Rs, Rp, Cp, and Ls decreased with increasing SoC, and vice versa At 0% SoC, Cp rapidly increased compared to that at 100% and 50% SoC. Thus, at 0% SoC, Cp increased with ZW.
Experimental results confirmed that the diffusion region, exhibiting a low-frequency characteristic at -5℃, corresponds to the FLW phenomenon as shown in Fig. 17.
As the SoC decreased from 100%, 50%, to 0%, the transformation from SSD to SCD occurred.
The values of Rs, Rp, Cp, and Ls at -5℃ are listed in Table 8.
Rs, Rp, Cp, and Ls (-5℃)
Fig. 18 compares the impedance spectrum results for the cylindrical lithium-ion battery at 0%, 50%, and 100% SoC under -20℃. The resistance value of the battery ranges from 23.4937 to 899.8488 mΩ.
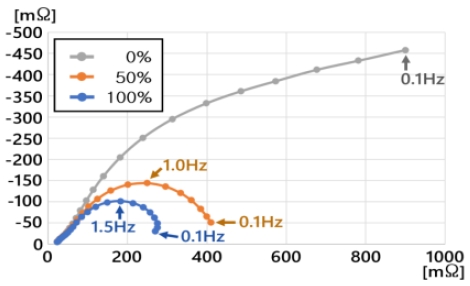
Impedance spectrum of the cylindrical lithium-ion battery at different SoCs under –20℃
Specifically, Rs, Rp, Cp, and Ls decreased with increasing SoC, and vice versa. At 0% SoC, Cp rapidly increased compared to that at 100% and 50% SoC. Thus, at 0% SoC, Cp increased with ZW.
-20℃ SoC, the corresponding Rs, Rp, Cp, and Ls values are provided in Table 9.
Rs, Rp, Cp, and Ls (-20℃)
The diffusion region, characterized by a low-frequency response at -20℃, was experimentally confirmed to manifest as FLW, as shown in Fig. 18.
As SoC decreased from 100%, 50%, to 0%, transformation from SSD to BD occurred.
4. Conclusion
This study examined the influence of temperature and SoC on the diffusion area’s EIS properties in a cylindrical lithium-ion battery.
The change in the diffusion area with decreasing temperature from 40℃ to -20℃ was as follows.
At high SoC levels (100% and 50%), the diffusion behavior followed the sequence: WD → SSD → BD. At 0% SoC, the pattern shifted from WD to SCD.
As SoC decreased from 100% to 0%, the diffusion mode also changed depending on temperature. At 40℃, 25℃, and 10℃, WD was maintained. At -5℃, the transition occurred from SSD to SCD, while at -20℃, it shifted from BD to SCD.
Furthermore, the results showed that the performance of cylindrical lithium-ion batteries deteriorated under low-frequency diffusion at 0 Hz and that the diffusion phenomena manifests differently depending on the battery’s SoC and ambient temperature.
The low-frequency diffusion region observed in the impedance spectra of the cylindrical lithium-ion battery demonstrated a progressive transition in diffusion behavior depending on both temperature and SoC. Specifically, the diffusion mode followed the sequential order of WD, SSD, BD, and finally, SCD.
Author contributions
J. Y. Bae ; Conceptualization, Investigation, Data curation, Formal analysis, Methodology, Validation, Writing-original draft, Writing-review & editing.
References
-
P. Sun, R. Bisschop, H. Niu and X. Huang, 2020, “A Review of Battery Fires in Electric Vehicles”, Fire Technology, 56, 1361-1410.
[https://doi.org/10.1007/s10694-019-00944-3]

-
L. Komsiyska, T. Buchberger, S. Diehl, M. Ehrensberger, C. Hanzl, C. Hartmann, M. Hölzle, J. Kleiner, M. Lewerenz, B. Liebhart, M. Schmid, D. Schneider, S. Speer, J. Stöttner, C. Terbrack, M. Hinterberger and C. Endisch, 2021, “Critical Review of Intelligent Battery Systems: Challenges, Implementation, and Potential for Electric Vehicles”, Energies, 14(5989), 1-82.
[https://doi.org/10.3390/en14185989]
-
E. T. Sayed, A. G. Olabi, A. H. Alami, A. Radwan, A. Mdallal, A. Rezk and M. A. Abdelkareem, 2023, “Renewable Energy and Energy Storage Systems”, Energies, 16(1415), 1-26.
[https://doi.org/10.3390/en16031415]
-
B. K. Sovacool, 2009, “The importance of comprehensiveness in renewable electricity and energy-efficiency policy”, Energy Policy, 37, 1529-1541.
[https://doi.org/10.1016/j.enpol.2008.12.016]
-
S. Li, C. C. Mi and M. Zhang, 2013, “A High-Efficiency Active Battery-Balancing Circuit Using Multi-winding Transformer”, IEEE Transactions on Industry Applications, 49(1), 198-207.
[https://doi.org/10.1109/TIA.2012.2229455]
-
T. N. V. Krishna, S. V. S. V. P. D. Kumar, S. S. Rao and L. Chang, 2024, “Powering the Future: Advanced Battery Management Systems (BMS) for Electric Vehicles”, Energies, 17 (3360), 1-18.
[https://doi.org/10.3390/en17143360]
-
J. Li, D. Sun, X. Jin, W. Shi and C. Sun, 2019, “Lithium-ion Battery Overcharging Thermal Characteristics Analysis and an Impedance-Based Electro-Thermal Coupled Model Simulation”, Applied Energy, 254(113574), 1-12.
[https://doi.org/10.1016/j.apenergy.2019.113574]
-
P. Peng and F. Jiang, 2016, “Thermal Safety of Lithium-ion Batteries with Various Cathode Materials: A Numerical Study”, International Journal of Heat and Mass Transfer, 103, 1008-1016.
[https://doi.org/10.1016/j.ijheatmasstransfer.2016.07.088]
-
J. Kleiner, L. Komsiyska, G. Elger and C. Endisch, 2020, “Thermal Modelling of a Prismatic Lithium-Ion Cell in a Battery Electric Vehicle Environment: Influences of the Experimental Validation Setup”, Energies, 13(62), 1-18.
[https://doi.org/10.3390/en13010062]
-
E. Karden, S. Buller and R. W. D. Doncker, 2002, “A Frequency-domain Approach to Dynamical Modeling of Electrochemical Power Sources”, Electrochimica Acta, 47, 2347-2356.
[https://doi.org/10.1016/S0013-4686(02)00091-9]
-
M. Oldenburger, B. Bedürftig, A. Gruhle, F. Grimsmann, E. Richter, R. Findeisen and A. Hintennach, 2019, “Investigation of the low frequency warburg impedance of li-ion cells by frequency domain measurements”, Journal of Energy Storage, 21, 272-280.
[https://doi.org/10.1016/j.est.2018.11.029]